
If you search "best stocks for cash secured puts" you'll find the same recycled list of tickers. AAPL. MSFT. TSLA. Maybe a few dividend stocks thrown in.
The problem is the same one that plagues every static options list: it was written once, at a specific point in time, and it's already stale. The IV environment changes. Earnings windows shift. Sector rotation happens. A stock that was a great CSP candidate three months ago might be the worst possible choice today.
So this article isn't going to give you a list. It's going to give you the criteria — and then show you what those criteria look like using live data pulled this morning.
What Makes a Stock Actually Good for a Cash Secured Put?
Four things. In order of importance:
1. You'd genuinely be okay owning it at the strike
This is the one most people gloss over. A cash secured put is an obligation to buy 100 shares at the strike price if the stock drops below it. If that happens and you wouldn't want to own the stock at that price, you're in trouble.
Only sell puts on stocks you'd be comfortable holding. Not stocks you think won't go down. Stocks you'd actually want to own if they did.
2. IV rank is high enough to justify the risk
Implied volatility drives premium. But raw IV alone doesn't tell you enough — what matters is IV Rank, which tells you where current IV sits relative to the stock's own 52-week range.
A stock with 40% IV sounds decent. But if that stock's IV has ranged between 35% and 85% over the past year, you're selling at the low end of its range. The premium is cheap relative to what you could get.
Target IV Rank above 30% at minimum. Above 50% is ideal — you're selling premium when it's historically elevated, which is when the edge is real.
3. No earnings before expiration
Earnings are the CSP killer. A stock can have perfect IV, perfect liquidity, perfect chart — and then gap down 15% on a bad earnings report and assign you into an immediate loss.
Always check days to earnings before entering. Give yourself at least 30-45 days of earnings-free runway. If earnings fall within your expiration window, move to a closer expiration or skip the trade entirely.
4. Liquid options chain with tight spreads
Wide bid-ask spreads eat your premium before you even get in. If the bid is $0.50 and the ask is $2.00 on the put you want to sell, you're immediately giving up a massive chunk of your edge on the transaction.
Look for spreads under 15% of the mid price. This means the stock has active options participation — institutional traders, market makers, real volume. If open interest at your strike is under 50 contracts, move on.
The IV Trap — Why High IV Isn't Always a Good Thing
This is where a lot of traders get burned.
You see a stock with 90% IV and think: incredible premium, I have to sell this put. But ask yourself — why is IV that high? IV doesn't get elevated for no reason. Something is causing the market to price in big moves.
Maybe there's a binary event coming — an FDA decision, a merger vote, a key earnings report. Maybe the stock has been in freefall and the market is pricing in continued volatility. Maybe there's a short squeeze building.
High IV for a legitimate reason — elevated macro uncertainty, sector rotation, normal earnings cycle — is exactly what you want to sell. High IV because the stock is genuinely broken or facing a binary outcome is a trap. The premium looks great until the event happens and the stock gaps 30% in the wrong direction.
Always ask: why is IV this high? If you can't answer that question, don't sell the put.
What About High-Beta Names Like NVDA and AMD?
Most articles tell you to avoid high-beta stocks for CSPs. That's incomplete advice.
The real answer is: high-beta names can absolutely work for cash secured puts — if you combine the probability data with technical analysis. If AMD is sitting at a major support level, historical probability confirms 80% OTM, Monte Carlo backs it up at 65%, and earnings are 48 days away, that's a legitimate data-backed setup even on a beta 2.0 stock.
Here's a real example from StrikeScan's live scan this morning:
AMD — $175 put, May 1 expiration (44 DTE)
- Current price: $196.31 | Beta: 2.02
- IV: 57.2%
- Historical probability OTM: 80.2%
- Monte Carlo probability OTM: 65.4%
- ROI if expired worthless: 3.27%
- Days to earnings: 48 (no earnings before expiration)
Delta on this contract would suggest roughly 80% probability — and for once, historical data agrees. Monte Carlo is more conservative at 65.4%, which is the spread you need to pay attention to. On a beta 2.0 name in an elevated volatility environment, that 15-point gap between historical and Monte Carlo is telling you to size smaller than you would on a lower-beta name.
The traders who get hurt on high-beta CSPs aren't using probability data. They're selling puts on NVDA or TSLA because the premium looks juicy, without checking whether the strike has real support or what the actual probability metrics say. With the data, high-beta names open up a whole different set of opportunities. Without it, they're just expensive mistakes waiting to happen.
Real CSP Candidates Right Now — Live Data
Here's what the criteria actually look like in practice using live data from StrikeScan this morning. These aren't picks — they're examples of what the screening process surfaces when you run the right filters:
Walmart (WMT) — Consumer Defensive
- Current price: $125.08 | Beta: 0.66
- Strike: $123 put, April 24 expiration (37 DTE)
- Historical probability OTM: 76.4% | Monte Carlo: 54.6%
- ROI if expired worthless: 2.60%
- Days to earnings: 57
WMT is the definition of a stock you'd be okay owning. Stable, dividend-paying, defensive. Beta of 0.66 means it moves less than the market. 57 days to earnings — clean runway. The Monte Carlo coming in at 54.6% vs 76.4% historical is worth noting — current volatility is elevated relative to WMT's history. Size accordingly.
Amazon (AMZN) — Consumer Cyclical
- Current price: $215.20 | Beta: 1.42
- Strike: $210 put, May 1 expiration (44 DTE)
- Historical probability OTM: 75.1% | Monte Carlo: 51.7%
- ROI if expired worthless: 4.23%
- Days to earnings: 36
AMZN is a stock most traders understand and would be comfortable owning at $210. 36 days to earnings is on the shorter side — worth watching, but still outside the expiration window. The gap between historical (75.1%) and Monte Carlo (51.7%) is significant here. That's the current volatility environment talking. Defined risk or smaller size is the right approach.
Cameco Corporation (CCJ) — Energy
- Current price: $111.52 | Beta: 0.97
- Strike: $104 put, April 10 expiration (23 DTE)
- Historical probability OTM: 76.4% | Monte Carlo: 58.1%
- ROI if expired worthless: 3.82%
- Days to earnings: 50
CCJ is the largest publicly traded uranium company. Nuclear energy has a genuine tailwind — data centers need clean baseload power and uranium is benefiting. Beta of 0.97, 50 days to earnings, and a strike 6% below current price. The uranium sector has been volatile which explains the IV elevation — but this is IV high for a real macro reason, not a broken company reason.
Kratos Defense (KTOS) — Industrials
- Current price: $95.31 | Beta: 1.15
- Strike: $85 put, April 17 expiration (30 DTE)
- Historical probability OTM: 82.6% | Monte Carlo: 61.2%
- ROI if expired worthless: 4.47%
- Days to earnings: 49
KTOS is a defense technology company — drones, unmanned systems, satellite communications. With geopolitical tensions elevated and defense spending increasing, this is a sector with real fundamental support. 82.6% historical probability at the $85 strike with 49 days to earnings. The Monte Carlo at 61.2% reflects elevated macro vol — but the setup is clean.
Interactive Brokers (IBKR) — Financial Services
- Current price: $68.63 | Beta: 1.25
- Strike: $65 put, April 17 expiration (30 DTE)
- Historical probability OTM: 77.2% | Monte Carlo: 58.9%
- ROI if expired worthless: 3.38%
- Days to earnings: 120
IBKR stands out for one reason — 120 days to earnings. That's the longest earnings runway of any example here. Financial services, well known, $68 stock with liquid options. A conservative strike at $65 with 77% historical probability and over 4 months of earnings-free runway. This is the kind of boring, clean setup that compounds quietly over time.
How to Run This Scan Yourself in Minutes
Here's the honest problem with doing this manually: checking IV rank, probability, earnings dates, beta, spread width, and open interest on thousands of tickers one at a time takes hours. By the time you've finished, half the setups have already moved.
The workflow I built into StrikeScan solves this in two steps.
Step 1 — Filter stocks in the Stock Scanner
Start with the Stock Scanner and apply your criteria: market cap, price range, beta range. In seconds you get a filtered list of stocks that meet your baseline requirements.
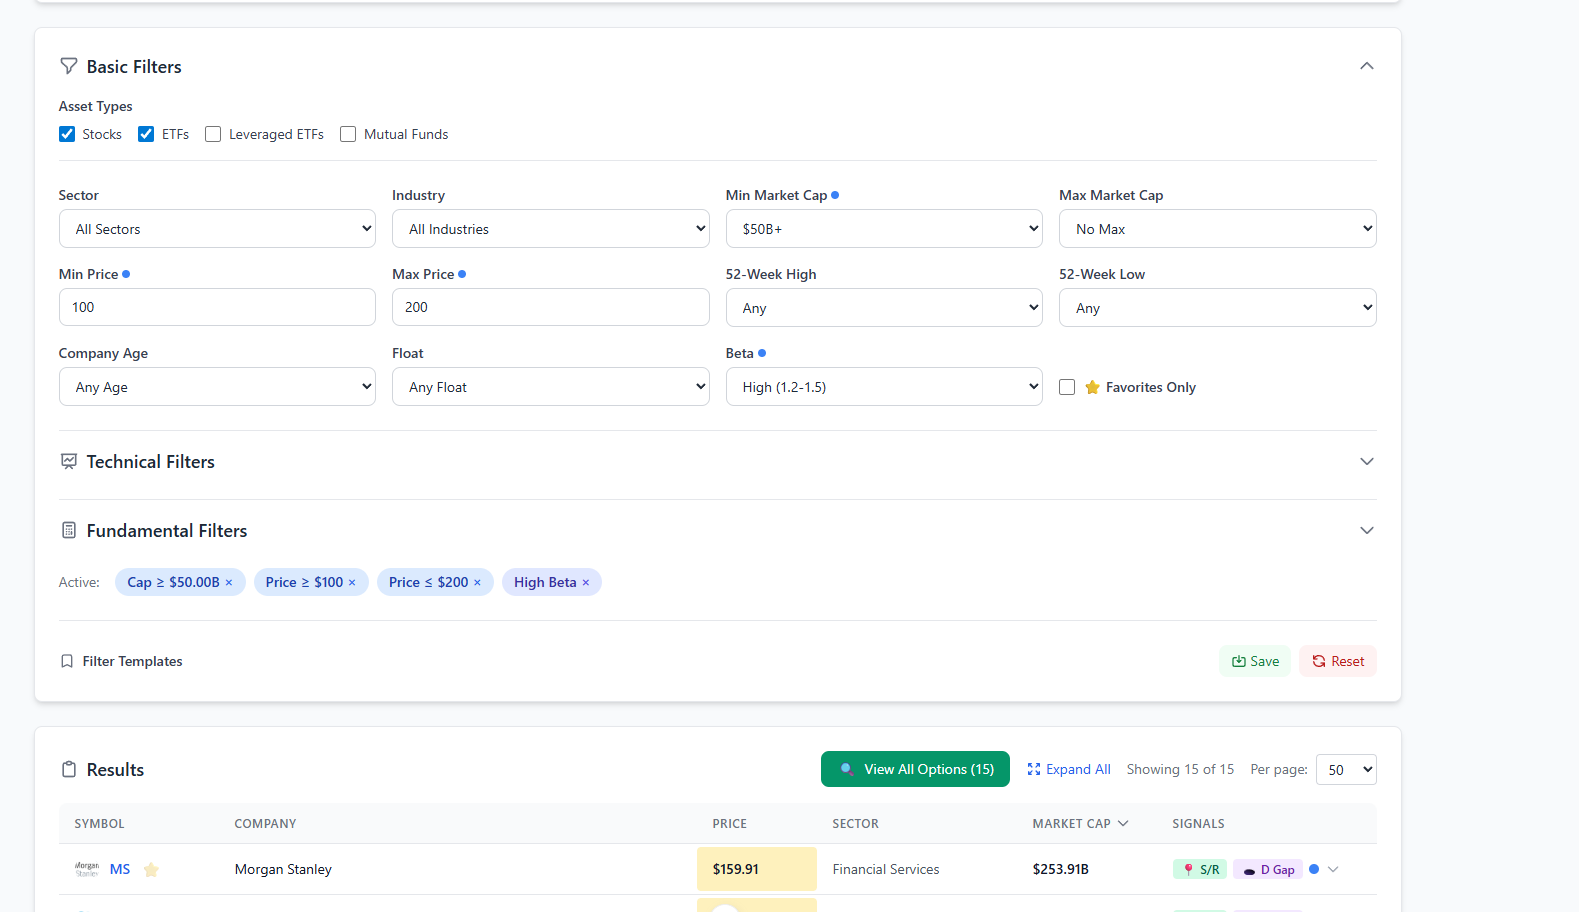
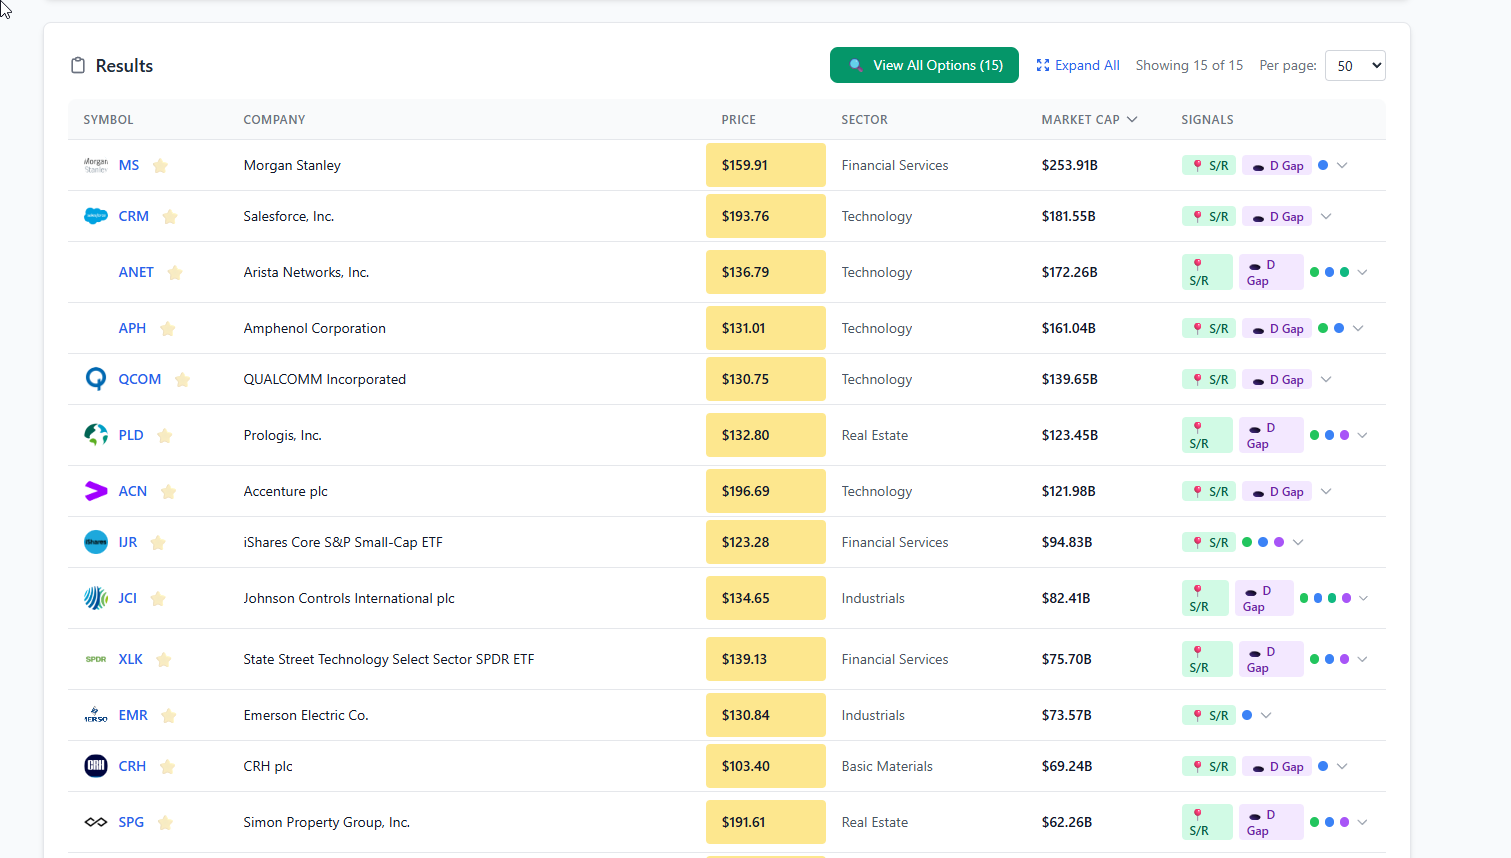
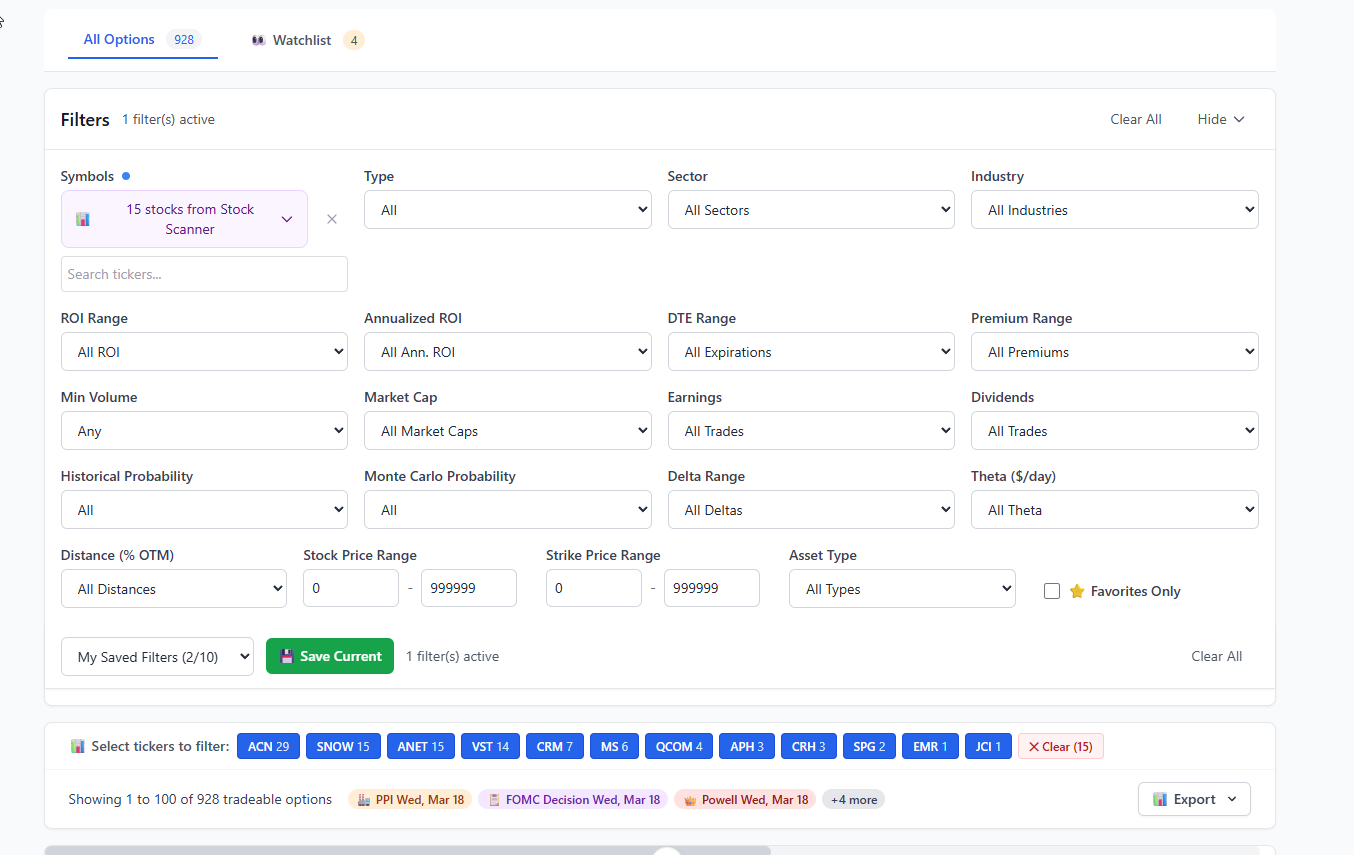
Step 2 — Click "View All Options" to load them into the scanner
One click loads every option contract across all your filtered stocks into the All Options scanner — updated every 15 minutes. You can then filter by put type, probability, DTE, ROI, earnings window, and spread quality all at once.
The results show you every relevant data point side by side — strike, distance OTM, DTE, bid, ask, ROI, annualized ROI, delta, IV, and crucially — both historical probability and Monte Carlo probability in the same row.
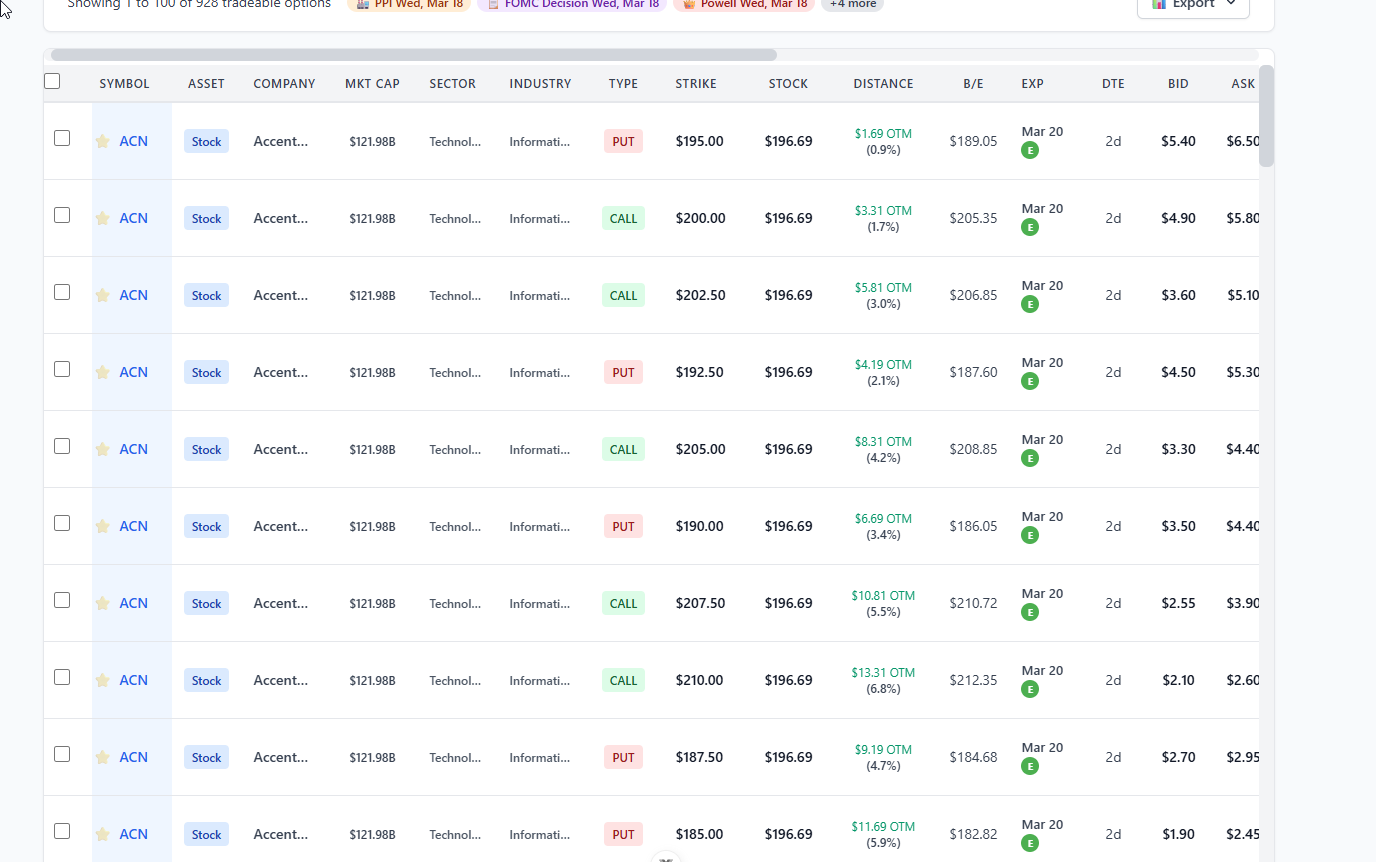
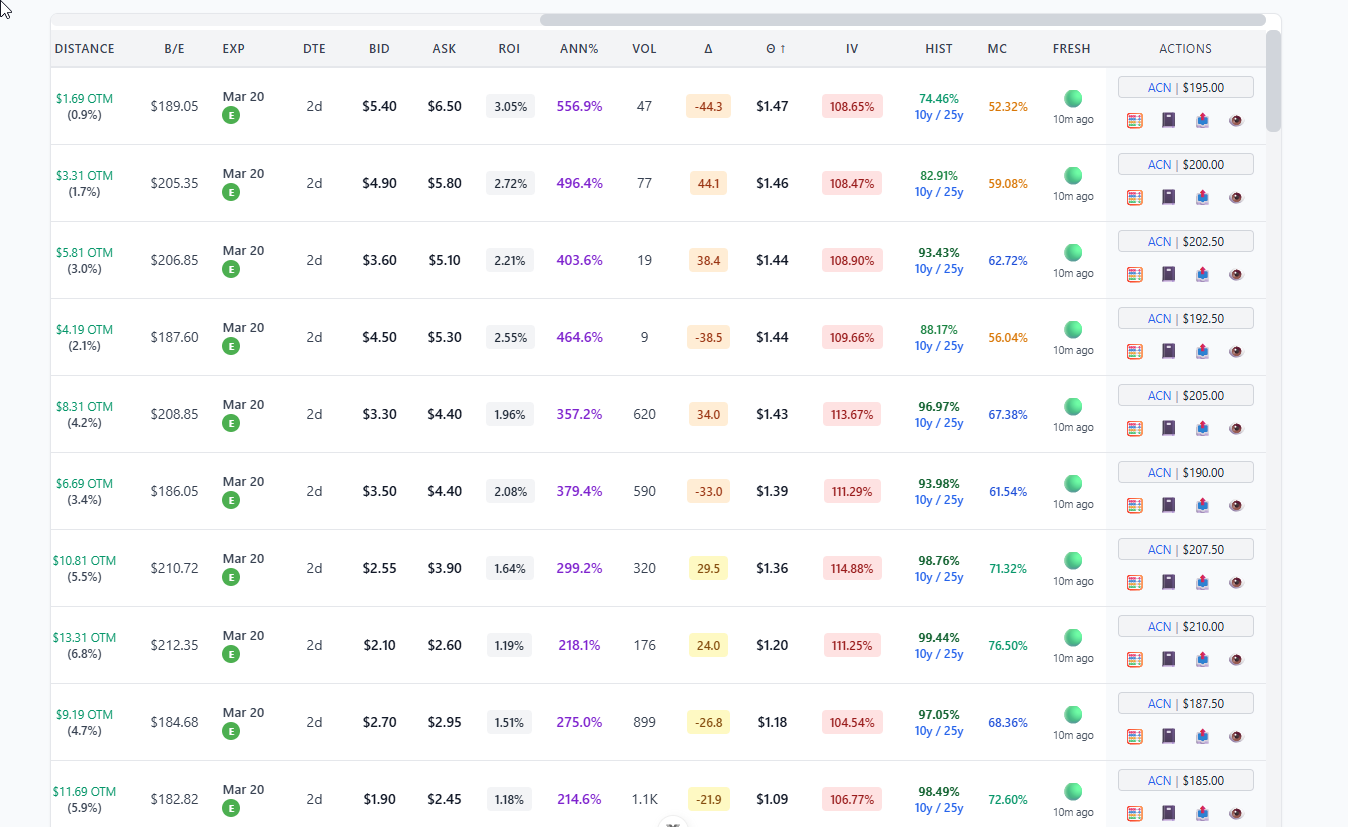
That's the whole workflow. Stock scanner to narrow the universe. All Options scanner to surface the specific contracts worth looking at. Two steps, live data, updated every 15 minutes.
Instead of spending hours checking tickers one by one, you see the entire filtered opportunity set in one place. Try it free at StrikeScan.com — still in free beta.
The Honest Truth About CSPs in 2026
Cash secured puts still work. The strategy hasn't changed.
What has changed is the environment. VIX is elevated in the low-to-mid 20s. Oil is above $90. FOMC is meeting today. The macro backdrop creates real tail risk that no probability model fully accounts for.
That means two things for CSP sellers right now. First, the premium is genuinely elevated — this is actually a good time to be selling options if you're selective. Second, the gap between historical probability and Monte Carlo probability is wider than normal — because current volatility is higher than what most stocks experienced in calmer periods. Respect that gap. Size smaller than you normally would. Use defined risk where it makes sense.
The criteria don't change. The stocks that fit them do — every single week.
Run the scan. Check the data. Don't just chase the highest premium.
Related Reading
Cash Secured Put vs Covered Call · My Pre-Trade Checklist for Selling CSPs and Covered Calls · What's the Average Return Selling Covered Calls?
Disclosure: I am the founder of StrikeScan, the platform referenced in this article. I do not currently hold positions in WMT, AMZN, CCJ, KTOS, IBKR, or AMD. This is not financial advice.