
I used to make sloppy trades. Not because I didn't know what I was doing — but because I didn't have a repeatable process. I'd see a setup that looked good, check a couple of things, and pull the trigger. Sometimes it worked. Sometimes it didn't. And I couldn't always explain why.
So I built a checklist. Not a theoretical one from a textbook — one based on the trades I actually made, the mistakes I actually paid for, and the patterns I noticed in what worked versus what didn't.
This is that checklist. Six questions. Every trade, every time.
Why a Checklist at All?
Options selling is a probability game. The edge is real — but only if you're consistent. One sloppy trade can wipe out three good ones. A checklist doesn't make you smarter. It makes you consistent. And in this game, consistency is the whole thing.
The goal isn't to find perfect trades. It's to avoid bad ones.
The 6-Question Pre-Trade Checklist
Question 1: Is IV Rank High Enough?
This is the foundation. IV Rank tells you where current implied volatility sits relative to the stock's own 52-week range. An IV Rank of 70% means the stock is in the top 30% of its most volatile year — premium is elevated and the edge is real.
My minimum: IV Rank above 30%. Below that I'm selling cheap premium and the risk/reward doesn't justify it. Above 50% is ideal.
One important nuance: ask yourself why IV is elevated. High IV for macro reasons — VIX spike, sector rotation, earnings cycle — is exactly what you want. High IV because the stock is in freefall or facing a binary event is a trap. The premium looks great until it isn't.
Question 2: Are There Earnings Before Expiration?
This is the non-negotiable. Everything else on this list has flexibility. Earnings don't.
A stock can have perfect IV, perfect chart, perfect probability — and then gap down 20% on a bad earnings report and assign you into an immediate loss. I always check days to earnings before entering any position. My rule: at least 30-45 days of earnings-free runway. If earnings fall within my expiration window, I either move to a closer expiration that clears earnings or I skip the trade entirely.
Selling a put into earnings is a completely different trade with a completely different risk profile. If you want to play earnings, that's fine — but know that's what you're doing. Don't stumble into it accidentally.
Question 3: What's the Trend and Where Is Price on the Map?
This is the one most options sellers skip. They focus entirely on the data — IV, probability, premium — and ignore the chart completely. That's a mistake.
Before I pick a strike, I want to know: where is price right now relative to the bigger picture? Is the stock in an uptrend, downtrend, or consolidating? Is it near a major support or resistance level? Is it extended after a big run, or pulling back to a level where buyers have historically stepped in?
You don't need to be a technical analyst to do this. You just need to ask: do I know where this stock has been, where it is now, and where it's likely to go? If you can't answer that, you don't have enough context to pick a good strike.
Question 4: Where Are the Key Support and Resistance Levels?
Once you know the trend, identify the key levels. For a cash secured put, you want your strike to be below a significant support level — a level where buyers have historically stepped in and held the stock. If your strike is sitting right at support and that level breaks, you're getting assigned immediately.
For a covered call, you want your strike to be above a significant resistance level — a level the stock has struggled to close above. If you sell a call right below a level the stock is about to break through, you're going to get called away at the worst possible time.
The best trades have the chart working in your favor. Strike below support for puts. Strike above resistance for calls. Let the levels do the heavy lifting.
Question 5: Does the Strike Make Sense Given the Chart?
This is where Questions 3 and 4 come together. Once I know the trend and the key levels, I ask: does my strike make sense?
For a CSP: Is my strike below a meaningful support level, not right at it? If WMT is at $125 and $120 is a clean support level with buyers consistently stepping in there, the $120 strike makes sense. The $123 strike right below current price with no meaningful support nearby does not.
For a covered call: Is my strike above a level the stock is unlikely to break through in the near term? If the stock just failed at resistance four times in a row, selling a call above that level is the right trade. If the stock is breaking out to new highs with momentum, selling a call right above the breakout level is not.
Question 6: Does the Probability Data Confirm It?
Once the chart passes the test, I check the data. I want to see:
- Historical probability OTM above 75%
- Monte Carlo probability OTM above 60%
- The gap between the two is reasonable — under 20 points
If historical probability says 82% but Monte Carlo says 45%, the two models are disagreeing significantly. That's a signal to size smaller or skip the trade. In an elevated volatility environment like right now, Monte Carlo tends to be more conservative because it incorporates current vol conditions. When it diverges sharply from historical, respect that divergence.
A Real Example — TSLA Covered Call
Here's exactly how this checklist played out on a real trade I made at the end of 2025.
TSLA had run hard — four consecutive green weeks. IV was elevated because of the momentum. The setup looked interesting for a covered call. Here's how I walked through the checklist:
IV Rank? Elevated after four straight green weeks. IV was rich — exactly what you want for selling calls.
Earnings? Checked — earnings were far enough out that the expiration I was targeting was clean.
Trend and where is price on the map? This is where it got interesting. TSLA had been on an enormous run — and it was approaching the 2024 Previous ATH around $484. That's a major level. A prior all-time high is one of the strongest resistance levels there is.
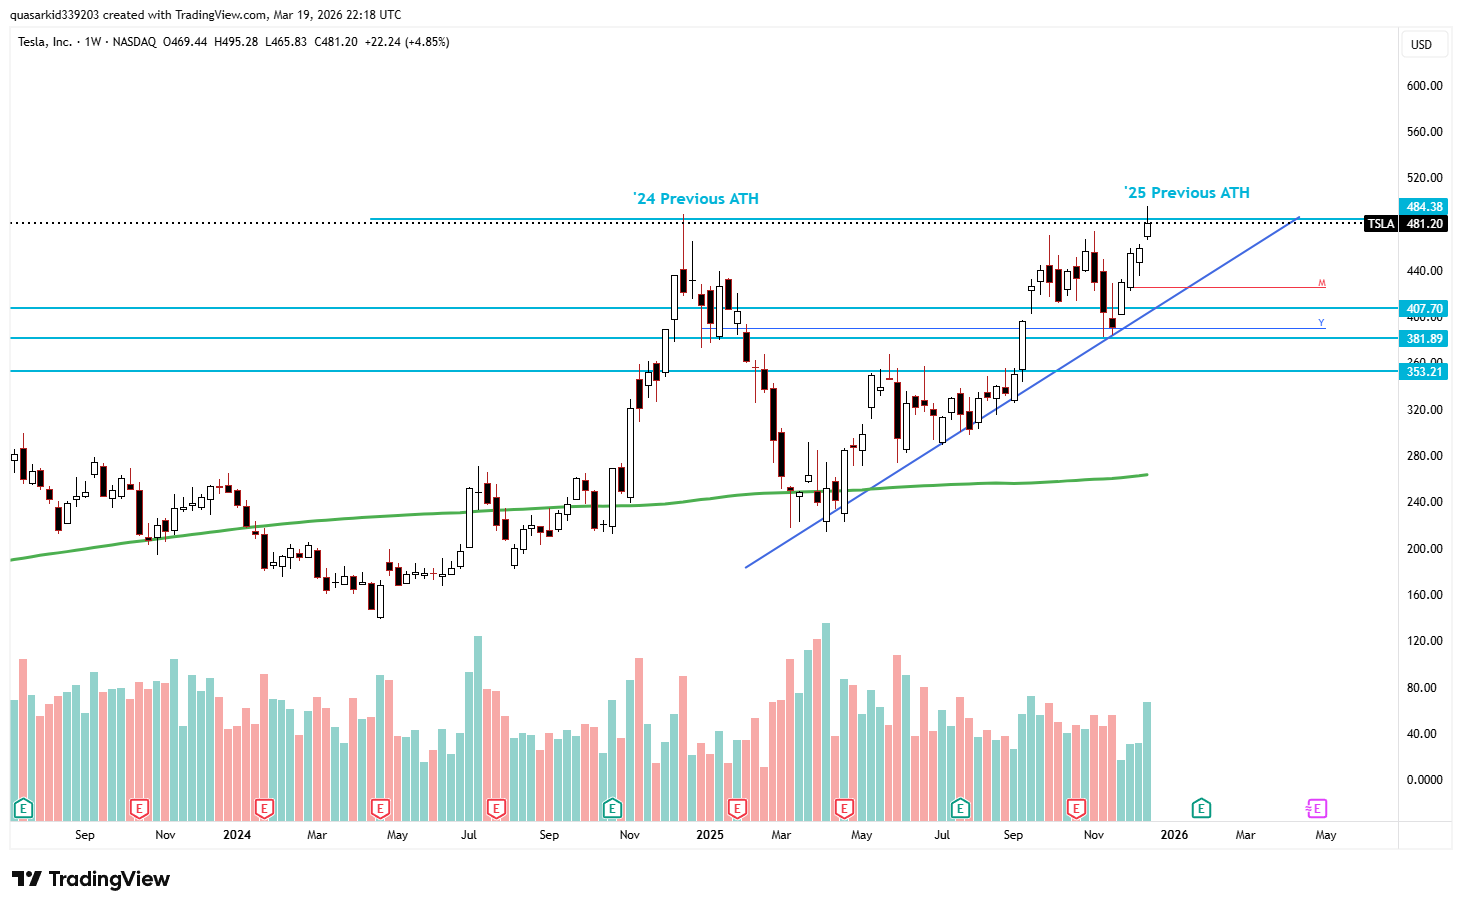
Key resistance level? The 2024 Previous ATH at $484. That's the level. If TSLA couldn't close above it, the move was likely exhausted.
Does the strike make sense? I sold calls in the $520-530 area — well above the ATH resistance. My logic: if TSLA can't even close above $484, it's not getting to $520. The resistance level gave me a natural buffer above my strike.
Probability data? With the strike that far OTM and the resistance overhead, the probability confirmed the setup. The premium was solid — four straight green weeks into ATH resistance does that.
Then this happened:
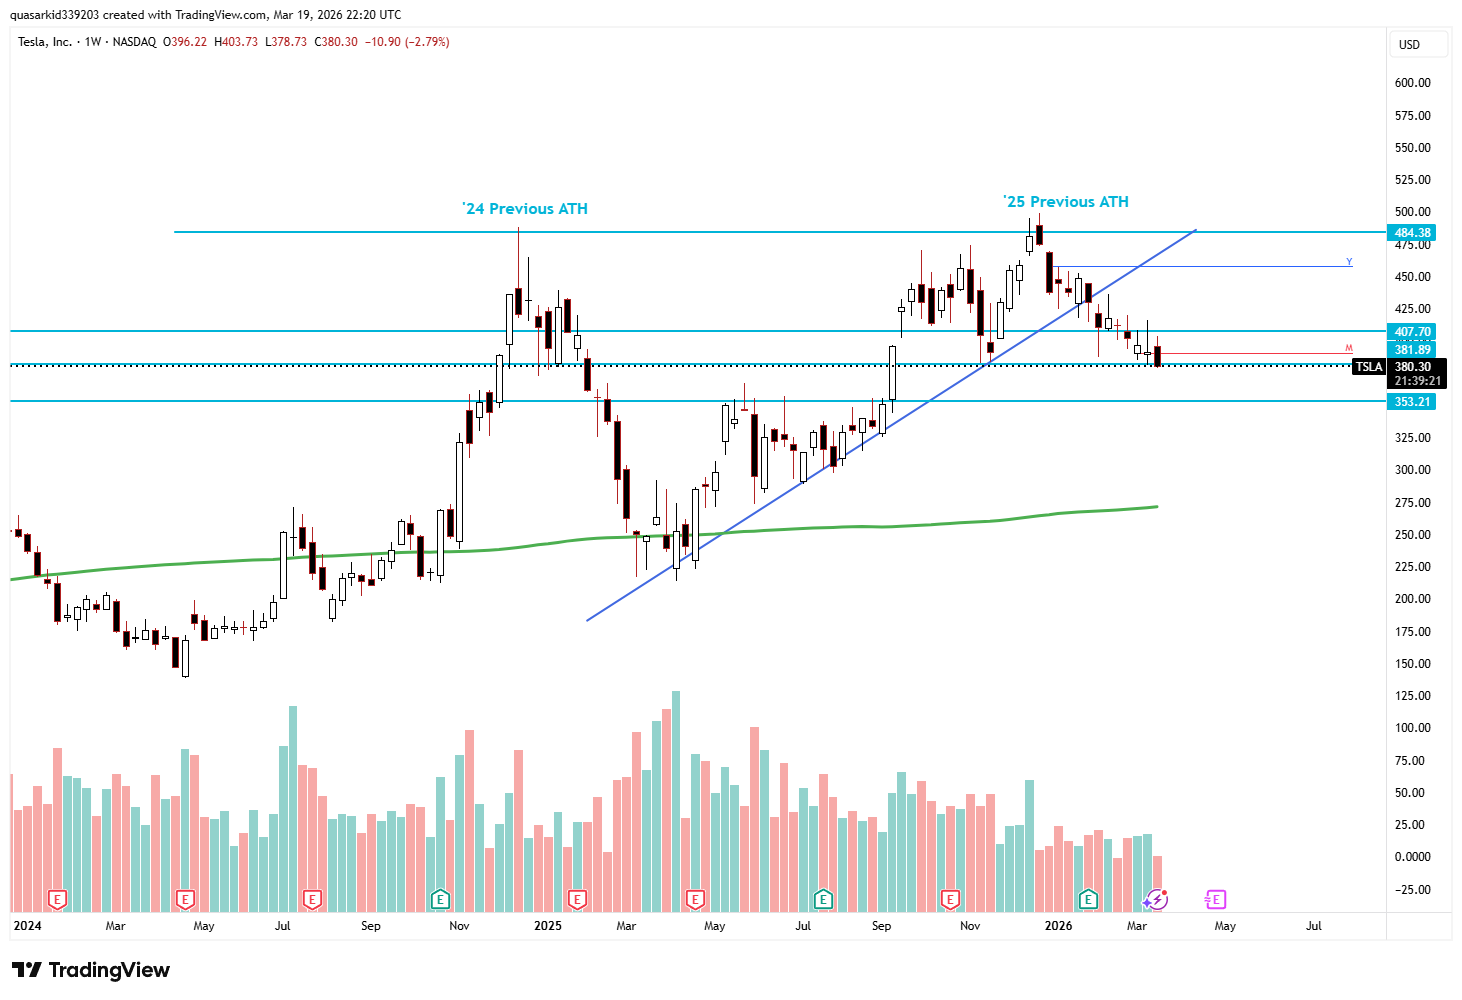
TSLA failed to close above the 2024 ATH. After four straight green weeks and a failed breakout, it's been in a downtrend ever since — now trading around $380. The calls expired worthless. The premium was kept.
That's the checklist working exactly as intended. Not luck. Not a guess. A process.
What "Good Enough" Actually Looks Like
Not every box has to be perfect. Here's how I weight the list:
Non-negotiables — if these fail, I walk away:
- Earnings before expiration — always check, never skip
- Strike makes sense with the chart — if the chart is against you, the data doesn't matter
Strong preferences — I want these but have flexibility:
- IV Rank above 30% — below this the premium usually isn't worth it
- Historical probability above 75% — this is my confidence floor
- Monte Carlo within 20 points of historical — a wide gap means size smaller
Four out of six is usually fine. But if earnings or the chart are against you, no combination of good data makes it the right trade.
When to Walk Away
Three situations where I skip the trade regardless of how the premium looks:
Earnings within the expiration window. Already covered — this is the hard rule. Premium is elevated because of the binary risk, not because the setup is good.
Low IV Rank. If IV Rank is under 20%, you're selling cheap premium into a calm stock. The premium barely moves the needle and the risk of assignment into a move you didn't get paid for is real.
The chart is unclear or working against you. If you can't identify the trend, if the stock is sitting right at a key level that could break either way, or if the chart is telling you something different from what the data is suggesting — trust the chart. The best trades have the chart and the data pointing in the same direction.
How I Run This in Under 5 Minutes
Running this checklist manually used to take forever. Pulling up IV rank in one place, checking earnings in another, flipping to a chart, then opening the options chain — four or five different tabs just to answer six questions.
That's one of the main reasons I built StrikeScan. The scanner surfaces IV rank, earnings flags, historical probability, and Monte Carlo probability all in one place. I can run through questions 1, 2, and 6 in seconds just by looking at the scanner results. Questions 3, 4, and 5 still require looking at the chart — that's intentional, no tool replaces reading price action — but everything else is right there.
Instead of 20 minutes of tab switching, the data part of the checklist takes under two minutes. Then I spend the rest of my time on the chart — which is where the real edge is anyway.
Try it free at StrikeScan.com — no account needed for the scanner.
The Bottom Line
A checklist doesn't guarantee winning trades. Nothing does. What it does is eliminate the sloppy ones — the trades you entered because the premium looked good without asking the right questions first.
Six questions. Every trade. That's the whole process.
IV rank high enough? Earnings clear? Trend understood? Key levels identified? Strike makes sense? Probability confirms? If yes across the board — take the trade with confidence. If not — move on. There's always another setup.
Related Reading
Cash Secured Put vs Covered Call · How I Find Options Trades Each Morning · What's the Average Return Selling Covered Calls?
Disclosure: I am the founder of StrikeScan, the platform referenced in this article. As of this writing, I currently hold a position in TSLA. The covered call example referenced has since closed but I still hold the underlying shares. This is not financial advice.